04-12-2016, 10:51 AM
Thank you for supporting my work, and for helping to maintain our incredible forum community!
conspiracy
04-25-2016, 02:45 PM
Here is the daily TLT chart I am looking at. Everyone thinks we are going to negative rates, speculating that could come but maybe later than everyone expects
04-25-2016, 02:56 PM
Daily
Thicker dashed reb fib from 11/6/15 118 price low to 2/18/16 135.25 high
Thicker green rev fib from 135.25 high to 127.21 swing low
Lesser dashed red rev fib from 127,21 to presumed 132.99 swing high
Thin cloud; tk cross to the downside, future cloud bearish, lots of air below
Fib confluence cluster at 124.59-125
Lower target at 121.43
May hold range bound if price van get above and hold 129ish handle
04-25-2016, 03:02 PM
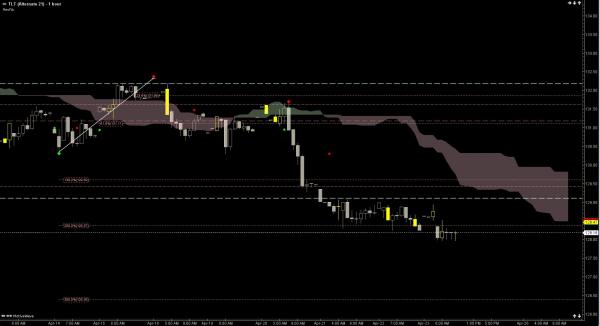
TLT revfib hourly

-- price below thick cloud
-- added one revfib line on the hourly chart; other fibs from daily chart still showing -- see white solid line for additional rev fib
Analysis provides additional support for 129ish handle as important to the upside as well as adds 128.37 target (captured) and 126.39 target (interim on the way down to 121 area?
04-28-2016, 09:26 PM
At the first hourly refib - can it make it up to where A=C at 129.75? Also where the 50 ma seems to be rolling over.
05-05-2016, 08:15 AM
Not sure where this is. Late yesterday we got the 1- 4 overlap - so could be nested now or it is in W3 of 5 up - whatcha think with the Cloud? Looking at the previous prictures, I would think we are now at the top of the hourly cloud (not yet broke out?) and over the cloud on the daily looking only at thin cloud moving forward for the next couple of weeks.
What worries me is I see bear warning signs
1) MACD and RSI bottoming?
2) pulled back to where it needed to in order to stay in potential bull count
What worries me is I see bear warning signs
1) MACD and RSI bottoming?
2) pulled back to where it needed to in order to stay in potential bull count
05-05-2016, 10:59 AM
Daily... think present cloud ---volatile price action anticipated (FED heads all talking today after market of course)
Rangy price action.., personaly watching for a big candlestick statement in the 130 area... hold above 130 good for prices (longs) bad for yields (short)
My count here (not shown on daily) from the 135.25 Feb 11 high) -- A down, now working larger abc for B to finish up at either 132.18 (running flat) or regular flat correction... not expecting 135.25 to be taken out to the upside
Hourly -- left the daily fibs on and didnt add any lesser timeframe ones.... bullish above cloud and cloud rising/trending higher.... May 3 gap and hold above cloud figuring prices rise higher to the 131-132 handle
Finally, I think that China wants to deval to keep bonds yields low... US wants some raise in rates for inflation targets and growing econ narrative... somehow I think gold gets smackdown so that China can get something it likely wants in lieu of rates that have to rise otherwise the world econ implodes and we get the big down wave that all bears see...
05-15-2016, 04:26 PM
I have a bear position in SPX going into this week but I am unsure where the risk really is
SPX - PL is sounding bearish (talking this weekend about nested 3rd wave decline psychology). Potenital is there for nested decline but it has not validated much of anything to the downside yet (not breaking below 2040).
SPX - PL is sounding bearish (talking this weekend about nested 3rd wave decline psychology). Potenital is there for nested decline but it has not validated much of anything to the downside yet (not breaking below 2040).
05-15-2016, 04:28 PM
TLT
Not sure what to think. This rally has gone further than I expected. I am having a hard time counting it. If I can find a bear pattern (ABC) when it gets close to ATH - the R/R setup would be there - just unsure now.
Not sure what to think. This rally has gone further than I expected. I am having a hard time counting it. If I can find a bear pattern (ABC) when it gets close to ATH - the R/R setup would be there - just unsure now.
05-29-2016, 10:21 PM
05-31-2016, 11:32 PM
Still not sure what to think on TLT - see potential bull setup on the daily but potential bear setup on the hourly
« Next Oldest | Next Newest »
Users browsing this thread: 2 Guest(s)
Thank you for supporting my work, and for helping to maintain our incredible forum community!


![[+]](https://www.deepwaveanalytics.com/forum/images/bootbb/collapse_collapsed.png)